Software delivery has never been more critical to the success of business in every industry. It’s also never been more complex. Expectations for delivering high-quality software incredibly fast have skyrocketed - yesterday’s most exceptional product experiences are expected today to be more beautiful, intuitive, powerful, and affordable.
But the landscape of tools, platforms, and architectures is constantly evolving. With this rapid pace of change and the growing challenges of complexity, how can engineering teams not only succeed but beat out the competition?
Jeremy Meiss
DevRel & Community professional
Open to work
So back to the tech industry…
We have entered into a period of immense change, and with the global economic uncertainties presented impacting companies of all sizes.
Amidst this environment, stability and reliability have become increasingly important to businesses globally. The ability to provide a reliable, stable platform to customers has become a crucial value metric to engineering teams and will only continue to increase in importance this year.
As CI adoption expanded over the last several years, many teams have had a “growth at all costs” mentality. But as the complexity of software systems increased, the cognitive load of maintaining those systems has really become overwhelming for both the devs and ops sides, creating situations where teams were cutting corners. DevOps teams must take away some of the complexity and be in a position to help systems recover quickly from failures. This is why many companies have instituted a Platform team — the need for a dedicated team to support the stability of their application has become obvious. More to come on that later.
Some of you may be familiar with the industry reports like the State of DevOps Report, the State of Cloud Native Report, and the CDF’s own State of Continuous Delivery Report. These reports are great for understanding the industry as a whole, but they don’t really give you a good idea of how your team is performing as they’re largely based on self-reported data, and the memory of those taking the surveys. The report I will be talking about today is the State of Software Delivery Report, which CirclecI started compiling yearly in 2019, and is largely based on anonymized data from CircleCI’s own platform of how developers and teams are actually working.
Image: Consumer Choice Center
I don’t believe in one-size-fits-all success metrics, because you’re company and business isn’t the same as the person sitting next to you. Unless you’re coworkers, which could make this a really uncomfortable, and revealing, conversation.
CI/CD Benchmarks for high-performing teams
Duration
Mean time to resolve
Success rate
Throughput
So we’re going to be talking about these standard engineering metrics, and how the data reveals some recommended benchmarks for each. But I do want to stress that these are “recommended”, and that ultimately your business needs will play a big part into what a high-performing engineering team looks like for you.
We’ll also talk a little bit about the optimization steps necessary - sometimes through culture, structure, and strategy - in order to make sure you’re maintaining a key ingredient in achieving success: developer happiness.
Duration
the foundation of software engineering velocity, measures the average time in minutes required to move a unit of work through your pipeline
Duration is the foundation of software engineering velocity. Now this unit of work does not always mean deploying to production – it may be as simple as running a few unit tests on a development branch.
Duration, then, is best viewed as a proxy for how efficiently your pipelines deliver feedback on the health and quality of your code. The core promise of most software delivery paradigms, from Agile to DevOps, is speed: the ability to take in information from customers or stakeholders and respond quickly and effectively.
These rapid feedback and delivery cycles don’t just benefit an organization’s end users; they are crucial to keeping developers happy, engaged, and in an uninterrupted state of flow.
So what’s the ideal duration?
Duration Benchmark
<=10 minute builds
"a good rule of thumb is to keep your builds to no more than ten minutes. Many developers who use CI follow the practice of not moving on to the next task until their most recent check-in integrates successfully. Therefore, builds taking longer than ten minutes can interrupt their flow."
– Paul M. Duvall (2007). Continuous Integration: Improving Software Quality and Reducing Risk
To get the maximum benefit from your workflows, the recommendation is to aim for a duration of 10 minutes, which is a widely accepted benchmark that dates back to Paul M. Duvall’s influential book on Continuous Integration. At this range, it is possible to generate enough information to feel confident in your code without introducing unnecessary friction in the software delivery process.
Duration: What the data shows
Benchmark: 5-10mins
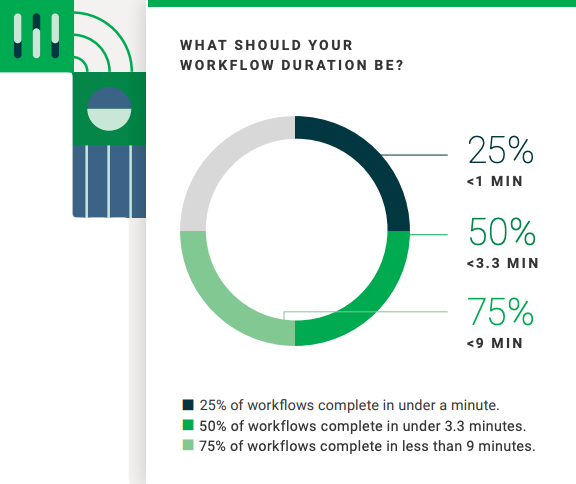
Among the workflows observed in the dataset, 50 % completed in 3.3 minutes or less; 25% of workflows completed in under a minute; 75% completing in under 9. The avg duration was approx 11 minutes, reflecting the influence of longer-running workflows in the 95th percentile requiring 27 minutes or more to complete.
Improving test coverage
Add unit, integration, UI, end-to-end testing across all app layers
Add code coverage into pipelines to identify inadequate testing
Include static and dynamic security scans to catch vulnerabilities
Incorporate TDD practices by writing tests during design phase
Many teams continue to bias toward speed rather than robust testing. But the number one opportunity for improving performance across all four software delivery metrics is to enhance your test suites with more robust test coverage.
Teams who focus only on speed, not only will spend more time rolling back all their broken updates and debugging in production, BUT they’ll also face greater risk to to their org’s reputation and stability. Optimizing workflow durations means combining comprehensive test practices with efficient workflow orchestration.
Mean time to Recovery
the average time required to go from a failed build signal to a successful pipeline run
MTTR is a metric indicative of your team’s resilience and ability to respond quickly and effectively to feedback from your CI system. Meaning, it’s the best indicator of your org’s DevOps maturity.
The way user’s, and most org’s, see it, nothing is more important than your team’s ability to recover from a broken build. Customers are unlikely to notice the steady stream of granular updates made throughout the week, but they damn well will notice when broken code slips through your test suite.
"A key part of doing a continuous build is that if the mainline build fails, it needs to be fixed right away. The whole point of working with CI is that you're always developing on a known stable base."
– Martin Fowler (2006). “Continuous Integration.” Web blog post. MartinFowler.com
In 2006, Martin Fowler described the north star for software teams’ MTTR: “Fix broken builds immediately.” Does this mean your team should aim for resolving failed workflows within a matter of seconds? Or better yet avoid build failures at all costs? Not at all! Broken builds happen, but with proper tests in place, the info from a red build has as much (if not more) value for development teams as a passing green build.
MTTR Benchmark
<=60min MTTR on default branches
As a result, it’s recommended that you aim to fix broken builds on any branch in under 60 minutes. Depending on the scale of your user base and criticality of your application, your target may be significantly lower or higher. However, the ability to recover in under an hour is strongly correlated with the other metrics, and will allow your organization to avoid the worst outcomes of prolonged failures.
MTTR: What the data shows
Benchmark: 60 mins
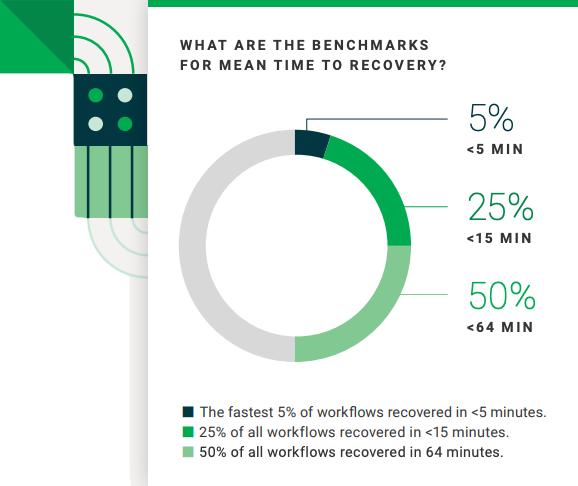
The data set shows 50% recovery in 64min or less, down from almost 10min longer. The top 25% recovered in 15 min or less, and the top 5% in under 5.
Treat your default branch as the lifeblood of your project
The first step to lowering recovery times is to treat your default branch as the lifeblood of your project – and by extension, your organization. While red builds are inevitable, getting your code back to green immediately should be everyone’s top priority. With a vigilant culture in place, your organization will be poised to leverage information from your CI pipeline and remediate failures as soon as they arise.
Getting to faster recovery times
Treat default branch as the lifeblood of your project
Set up instant alerts for failed builds (Slack, Pagerduty, etc.)
Write clear, informative error messages for your tests
SSH into the failed build machine to debug remote test env
Recovery speed is completely bound with pipeline duration: shortest possible TTR is the length of your next pipeline run. So all of these techniques require the other optimizations before you can get to faster recovery times.
Success rate
number of passing runs divided by the total number of runs over a period of time
Along with MTTR, success rate is another indicator of the stability of your AppDev process. But, the impact of success rate on customers and developers varies according to a few factors: What branch was the failure on (default or dev)? Did the workflow involve a deployment? How important is the app or service?
Failed signals are not all bad
A failed signal isn’t necessarily indicative of something going wrong or, a problem that needs to be addressed on a deeper level than your standard recovery processes. Far more important is your team’s ability to take in the signal quickly (DURATION) and remediate the error effectively (MTTR). Failed workflows that delivers fast, valuable signals are far more desirable than a passing workflow with little to no reliable info.
Success rate benchmark
90%+ success rate on default branches
Maintaining a success rate of 90% or higher on default branches is a reasonable target for the mainline code of a mission-critical app, where changes should be merged only after passing a series of well-written tests. Topic branch failures are generally less disruptive than those occuring on the default branch. It’s important for your team to set its own benchmark for success on non-default branches depending on how you use them.
Success rate: What the data shows
Benchmark: 90%+ on default
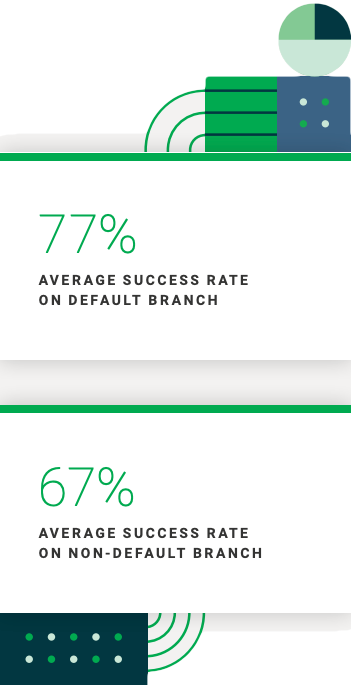
Back to the data: Success rates on the default branch were 77% on average, with 67% on non-default branches. The trends show that success rates on default branches have held steady over the past several reports. While neither reaches the benchmark of 90%, the pattern of non-default branches having higher numbers of failures indicates teams are utilizing effective branching patterns to isolate experimental or risky changes from critical mainline code. And while success rates haven’t moved much over the previous reports, recovery times have fallen sharply. This is a good sign that orgs are prioritizing iteration and resilience over momentum-killing perfectionism.
Throughput
average number of workflow runs that an organization completes on a given project per day
Throughput traditionally reflects the number of changes your developers are committing to your codebase in a 24-hour period
It is also useful as a measurement of team flow as it tracks how many units of work move through the CI system. When performed at or above recommended levels, throughput puts the “continuous” in continuous delivery — the higher your throughput, the more frequently you are performing work on your application.
Of course, throughput also tells you nothing about the quality of work you are performing, so it is important to consider the richness of your test data as well as your performance on other metrics such as success rate and duration to get a complete picture. As with duration, a high throughput score means little if you are frequently pushing poor quality code to users. So what’s ideal?
Throughput benchmark
It depends.
Of all the metrics, throughput is the most subjective to org goals. A large cloud-native org actively developing a critical product line will require far higher levels of throughput than a small team maintaining legacy software or niche internal tooling. It really does depend. There’s not a universally applicable throughput target - it needs to be set according to your internal business requirements. The type of work, the resources available, the expectations of your users all play into it. Far more important than the volume of work you’re doing is the quality and impact of that work.
Throughput: What the data shows
Benchmark: at the speed of your business
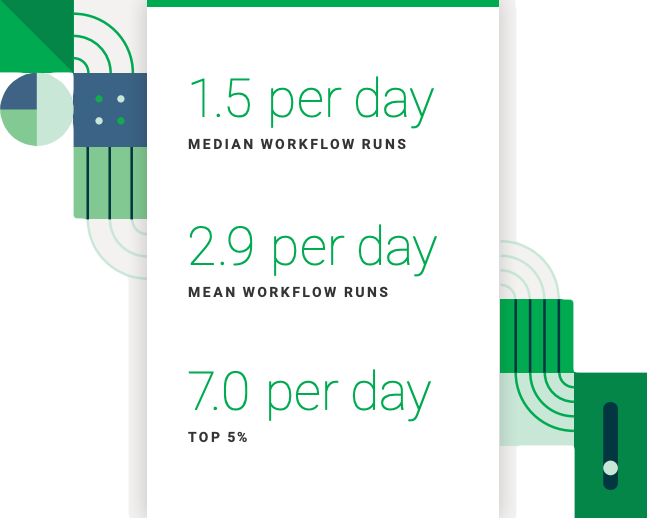
So, in the data the median workflow ran 1.54 times per day, with the top 5% ran 7 times per day or more - not much change from previous reports. Overall, the average project had 2.93 pipeline runs in 2023, a slight uptick compared to 2.83 in 2022. This uptick isn’t much, but when combined with the sharp decrease in MTTR, it could reflect that teams are committing to smaller, more frequent changes to limit the complexity of outages and achieve faster, more consistent feedback on the state of their applications.
Throughput is the most dependent on the other metrics
Throughput is the most dependent on the other metrics. How long your workflows take to complete, how often they fail, and the amount of time it takes to recover from a failure all affect your developers’ ability to focus on new work and the frequency of their commits. To improve your team’s throughput, you have to first address all the potential underlying factors that can affect team productivity, as previously identified.
Throughput is often a trailing indicator of other changes in your processes and environment. Rather than setting an arbitrary throughput goal, set a goal that reflects your business needs, capture a baseline measurement, and monitor for fluctuations that indicate changes in your team’s ability to do work. Achieving the right level of throughput means staying ahead of customer needs and competitive threats while also continuously validating the health of your application and development process.
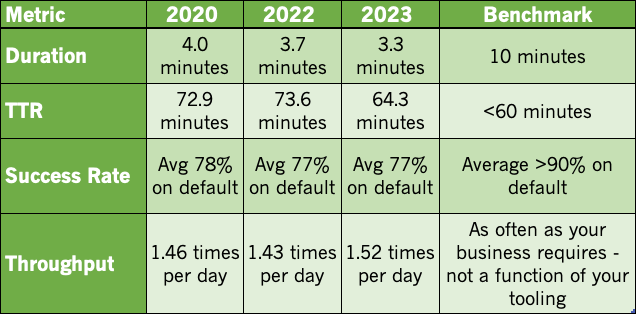
To sum up the data, here are the metrics over the last few years of the SoSDR. When you measure, and then optimize, these metrics, your teams (and company) gain a tremendous advantage over organizations that do not track these key metrics.
No, DevOps is not dead
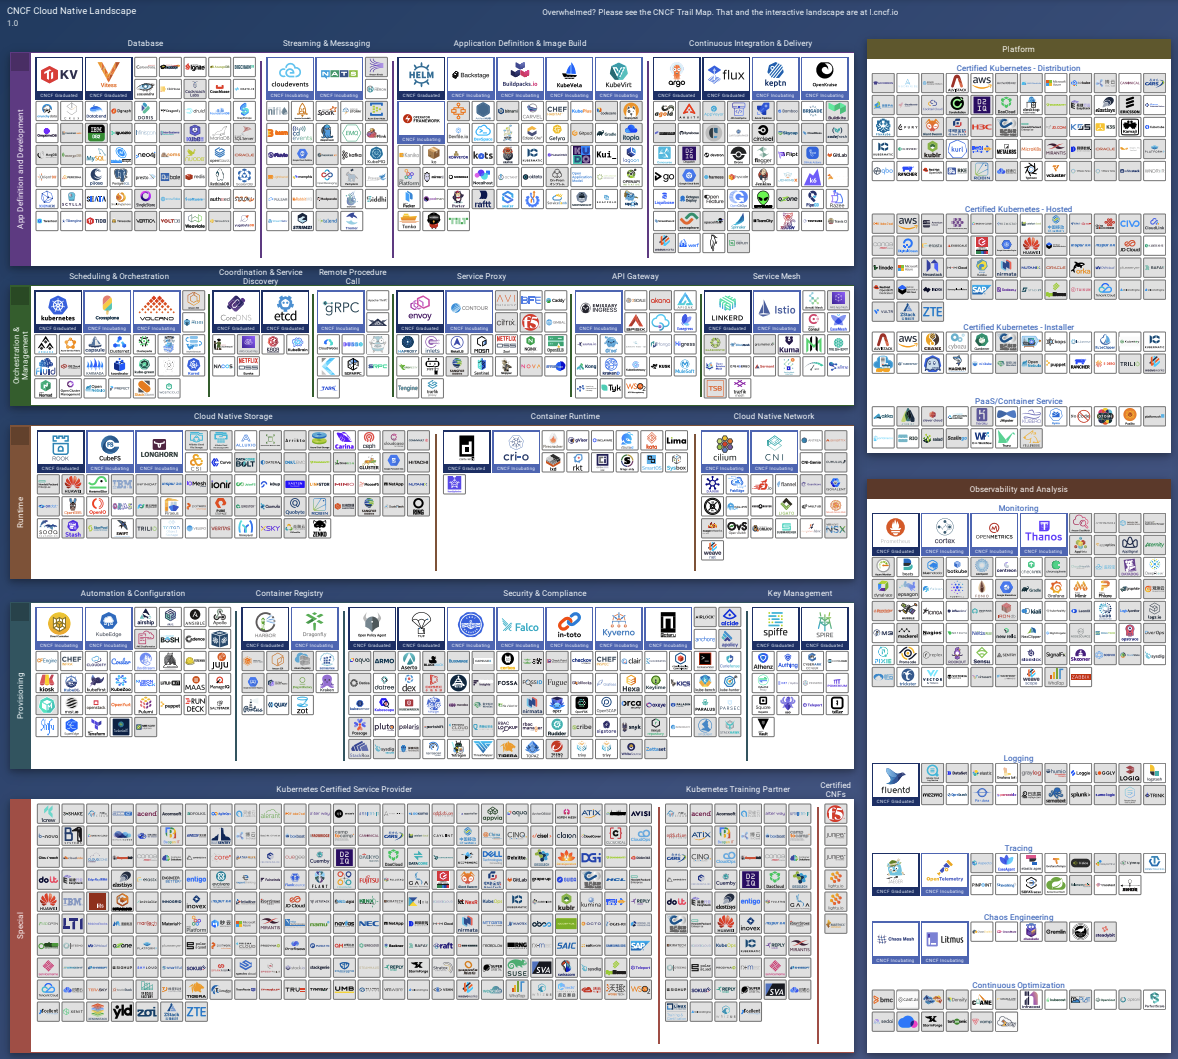
DevOps as a principle, a mindset of putting culture ahead of tools, and breaking down silos (physical and cultural) and growing lines of communication between Dev and Ops has been good. DevOps is not going anywhere, and still forms the construct for how high-performing engineering teams (and organizations) function. But at the same time, let’s think back to earlier where I talked about the complexity of modern app development, specifically illustrated with the CNCF landscape.
There’s constantly a need for devs to learn new tools and sometimes infrastructure, while coding and prioritizing ops tasks alongside feature development. The weight of these demands not only leads to lower levels of productivity and effectiveness, but it also shows up in stress, burnout, and reduced job satisfaction. And as a result, we’ve seen the cognitive load increase, driving up errors and negatively impacting the customer experience. So what are some of the practices your team can begin to incorporate to increase your platform’s stability, do more with less, and save money?
One of the things we’ve started seeing in the industry is a logical extension of a mature DevOps org… Platform engineering (or the Platform Team) Platform engineering is designed to work alongside existing DevOps concepts while alleviating the associated cognitive load. The general premise is to bring self-service to DevOps.
Platform engineers abstract the complexity of common DevOps processes into an internal developer platform (IDP) that provides a standard set of tools for building and deploying applications. Platform engineering aims to enhance DevOps, not replace it, by removing the need for developers to learn, develop, and maintain infrastructure tools and processes. So let’s look at how Platform engineering can contribute to achieving these metrics for high-performing engineering teams
Identify and eliminate impediments to developer velocity
Set guardrails and enforce quality standards across projects
Standardize test suites & CI configs (shareable configs / policies)
Welcome failed pipelines, i.e. fast failure
Actively monitor, streamline, & parallelize pipelines across the org
Duration: Developers will naturally gravitate toward speed. And while platform teams are tasked with identifying and eliminating impediments to developer velocity, that is not their only mandate. Another, perhaps more important, responsibility of the platform engineer is to set guardrails and enforce quality standards across projects. These optimizations can save you valuable developer minutes without sacrificing the quality of your builds.
Ephasise value of deploy-ready, default branches
Set up effective monitoring & alerting systems, track recovery time
Limit frequency & severity of broken builds w/ role-based policies
Config- and Infrastructure-as-Code tools limit misconfig potential
Actively monitor, streamline, & parallelize pipelines across the org
MTTR: Platform teams often form the bridge between an organization’s business goals and its software delivery practices. Equipping developers to recover from broken builds quickly can have a significant impact on an organization’s bottom line in terms of both developer productivity and customer satisfaction. Platform engineers can improve mean time to recovery in several ways.
With low success rates, look at MTTR & shorten recovery time first
Set baseline success rate, aim for continuous improvement, look for flaky tests or test coverage gaps
Be mindful of patterns & influence of external factors, i.e. decline on Fridays, holidays, etc.
Success rate: It can be tempting as an organization to chase a success rate of 100% or to interpret high success rates as a sign of elite software delivery performance. And while it is desirable to maintain high rates of success on default branches, this metric means very little if you are not confident in the signal you are receiving from your CI system. Platform engineers have a responsibility to look beyond surface-level metrics and uncover the most meaningful data about team performance.
Map goals to reality of internal & external business situations, i.e. customer expectations, competitive landscape, codebase complexity, etc.
Capture a baseline, monitor for deviations
Alleviate as much developer cognitive load from day-to-day work
Throughput: Platform engineering exists primarily to remove blockers from development teams and to provide all the tools and resources necessary for an organization to achieve maximum productivity. Thus, throughput is often one of the top indicators used to evaluate the performance of not just the development team but of the platform team as well.
2023 State of Software Delivery Report
go.jmeiss.me/SoSDR2023
Thank You.
/in/jeremymeiss
@IAmJerdog
@jerdog
@jerdog@hachyderm.io















 /in/jeremymeiss
 @IAmJerdog
 @jerdog
 @jerdog@hachyderm.io

